Connecting state and local government leaders
An interactive map gives water managers a glimpse into the historical factors driving water shortages so they can make data-driven decisions for a sustainable future.
State and local water managers have a new tool to help them understand freshwater availability, demand and depletion and inform data-driven decisions that preserve crucial water resources for future use.
An interactive world map uses hydrological models to show where freshwater shortages exist as well as water supply and demand trends across the residential, agricultural and industrial sectors. The tool, which launched March 20, operates on Esri’s ArcGIS platform and was developed by researchers at the National Geographic Society and Utrecht University in the Netherlands.
A water gap occurs when water use outpaces natural sources’ ability to replenish water and meet the current demand, according to National Geographic, which helped develop the map. Water scarcity has no one culprit and can be exacerbated by growing populations, urbanization, contamination and excessive use by households and corporations.
By 2071 nearly half of fresh water basins in the U.S. may fail to meet monthly water demands, which could have disastrous consequences, including poor air and water quality, increased risk of contracting harmful diseases and disruptions to the food supply chain.
To foster decision-making that improves water management in the future, policymakers can use the map to understand long-term changes in their water supplies, program manager at Esri Sean Breyer said. “As these data layers continually get updated … we’ll be able to start to look at change as policies get implemented. We should start to see rebounds in those water supply and demand gaps.”
The map pulls data spanning the last 40 years from national and international sources including forecasts from the National Weather Service, satellite imagery provided by NASA and the European Space Agency and climate models produced by The Intergovernmental Panel on Climate Change. Users can view water supply and demand measurements at the global, country, state and address level.
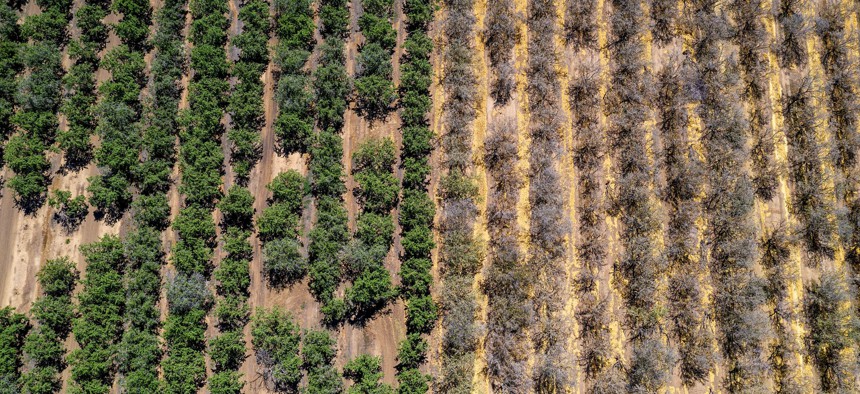
For instance, the map identifies Central Valley, California, as a water gap hotspot. Since 2003, groundwater losses have totaled about 36 million acre-feet, the Los Angeles Times reported.
“The trajectory we’re on right now is one for 100% disappearance,” Jay Famiglietti, a hydrology professor and executive director of the University of Saskatchewan’s Global Institute for Water Security, told the L.A. Times. “This is the water for the future generations. And it’s disappearing.”
Local city managers can supplement what they know about their current water conditions and cycles with the map’s historical data, which they may not have access to otherwise, to understand what long-term decisions make sense to mitigate water crises in their communities, Breyer said.
“In some cases, it's not about diverting water—it's about making water agreements. … In other cases, it's about conservation, coming up with new strategies for crops or changing domestic water habits … or start[ing] rain gathering,” he added. “There's lots of different ways, but it has to come from the local level.”
The map will be updated annually, with the potential to produce artificial intelligence-enabled water shortage predictions as the project develops, Breyer said. The map is a part of the National Geographic’s five-year World Freshwater Initiative that aims to leverage geovisualizations to promote freshwater availability, quality and sustainability.


